In a microservice environment it’s hard to trace errors and logs, as we have lots of moving components. We could go into each service and read the logs, then aggregate them and finally with lots of patience try to understand what is happening. But we should not do this, we have alternatives. One of them is Sleuth.
Sleuth offers distributed tracing for microservices. How does it do it? The answer is filters. They add unique ids to the requests, making them easy to trace. For example one trace could look like:
2017-09-27 13:28:42.030 INFO [item-command,32503587ec30801d,32503587ec30801d,false] 6 --- [nio-8083-exec-1] com.so.controller.ItemController : Creating item ItemRequest{itemCod
e='1', reservePrice=700}
2017-09-27 13:28:42.031 INFO [item-command,32503587ec30801d,32503587ec30801d,false] 6 --- [nio-8083-exec-1] com.so.service.ItemService : The service created the item 1, 7
00
If we break down the logs we can see the following format:
[app-name, trace-id, span-id, exportable]
App-name refers to the spring application name property that is present in your yaml file. Trace-id is the unique id that a requests gets. Span-id is a subset of that request; it can be the same as trace-id or it can be different, depends on how granular you want to go. Exportable it’s a flag that indicates if the logs is used by some kind of external system like Zipkin. We will go into details a little bit later.
OK, with this information we can trace a request with ease. We can be more granular by implementing a span for each operation if we want.
@Autowired
private Tracer tracer;

public CompletableFuture createItem(String itemCode, int reservePrice) {
   Span createItemSpan = tracer.createSpan("createItem method");
   try {
      logger.info("The service created the item " + itemCode + ", " + reservePrice);
      return itemRepository.save(new CreateItemCommand(itemCode, reservePrice));
   } finally {
      tracer.close(createItemSpan);
   }
}
The end result would be:
2017-09-27 14:37:58.360 INFO [item-command,b099f4b95dcc50a8,b099f4b95dcc50a8,false] 7 --- [nio-8083-exec-1] com.so.controller.ItemController : Creating item ItemRequest{itemCod
e='1', reservePrice=700}
2017-09-27 14:37:58.361 INFO [item-command,b099f4b95dcc50a8,d3a98e5a173bd83c,false] 7 --- [nio-8083-exec-1] com.so.service.ItemService : The service created the item 1, 7
00
Here we can see that the span-ids are not the same.
Sleuth is very powerful, as you can trace runnables and callables, it has aync and scheduled support. It works out of the box with Feign, Hystrix and Zuul. The trace information is passed by these services by default. More goodies can be found here.
Cool, we have learned how to trace the logs. But still, we need more as we don’t wanna go into each service and check them. We need some way to aggregate them and navigate easily through them. Zipkin can help us is this matter.
Like all the spring cloud libraries it’s pretty straightforward to use. You’ve guessed it, it’s just another spring boot app.
@SpringBootApplication
@EnableZipkinServer
public class Application {

   public static void main(String[] args) {
      SpringApplication.run(Application.class, args);
   }
}
Just start this and go to your machine on port 9411. You will get this:

Now that we’ve setup this, we need to start aggregating logs. But the question is how much logs do we need? All of them? Well to address this question there is
spring.sleuth.sampler.percentage=1.0
This means we need all of them. Of course there are ways to get rid of some of them, for example by reducing the percentage or setting skip patterns.
spring.sleuth.web.skipPattern=(^cleanup.*|.+favicon.*)
How much data you need depends on yourself. Ideally you don’t want to keep historical data.
OK. After we start all the application we can play with Zipkin.
First of all we must indicate our services that Zipkin service is present, by adding
<dependency>
 <groupId>org.springframework.cloud</groupId>
 <artifactId>spring-cloud-starter-zipkin</artifactId>
</dependency>
Next is to use yml to configure it
spring:
  application:
    name: item-command
  sleuth:
    sampler:
      percentage: 1.0
    web:
      skipPattern: (^cleanup.*)
  zipkin:
    base-url: http://${DOCKER_HOST_IP}:9411
Now we can see the exported parameter changed to true
INFO [item-command,32503587ec30801d,32503587ec30801d,true] 6 --- [nio-8083-exec-1] com.so.controller.ItemController : Creating item ItemRequest{itemCod e='1', reservePrice=700}
If we go to our zipkin server we can see the following:
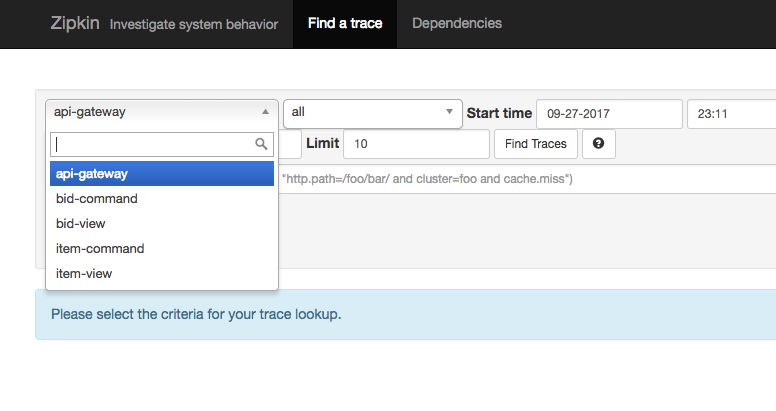
These are our applications where we have enabled log tracing. By selecting one of it and searching traces we see the following:
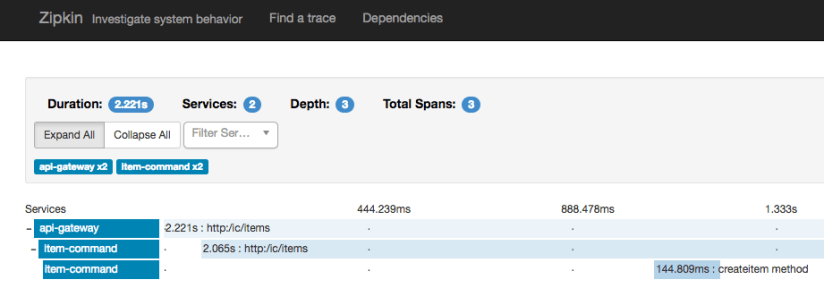
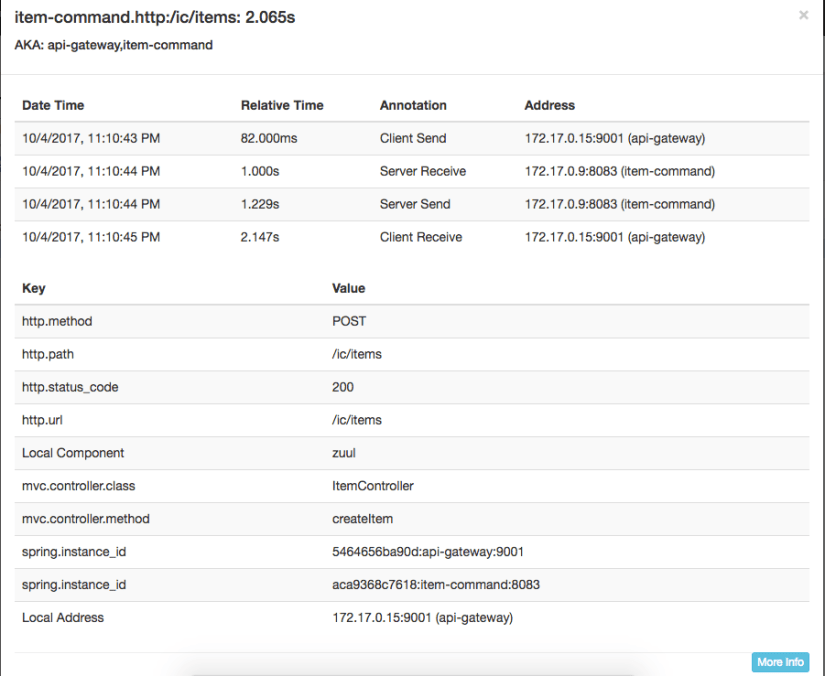
The path of the request is clearly visible, and more, we have also timing available. If we go further we can find even more information.
Cool. As we can see, Zipkin is easy to use and setup and has real value to our applications. To find out more go here.
SOURCE CODE

1 thought on “Log tracing with Sleuth and Zipkin”